DATA VISUALIZATION
|
|
|
|
|
DATA GOVERNANCE
DATA MONETIZATION
|
|
|

Copyright 2016 - Dynamic Database Support Systems, Inc. - All Rights Reserved
Chameleon Metadata® and What Color Is Your Data® and Chameleon Metadata logos are Dynamic Database Support Systems trademarks - Reproduction is prohibited without prior written permission

We are committed to meeting the toughest dolphin safety standards for creating websites that exist today. It is how the very best websites prove their strong commitment to ensuring NO nets (which we now know kill many dolphins each year) will be used during the creation, testing and deployment of their Internet websites. Remember, if dolphins had thumbs, we would be working for them.
Rather than nets, Dynamic Database Support Systems' websites use only the Internet . . . . and the Internet won't hurt any dolphins.
Powered By

DATA EXPLORATION
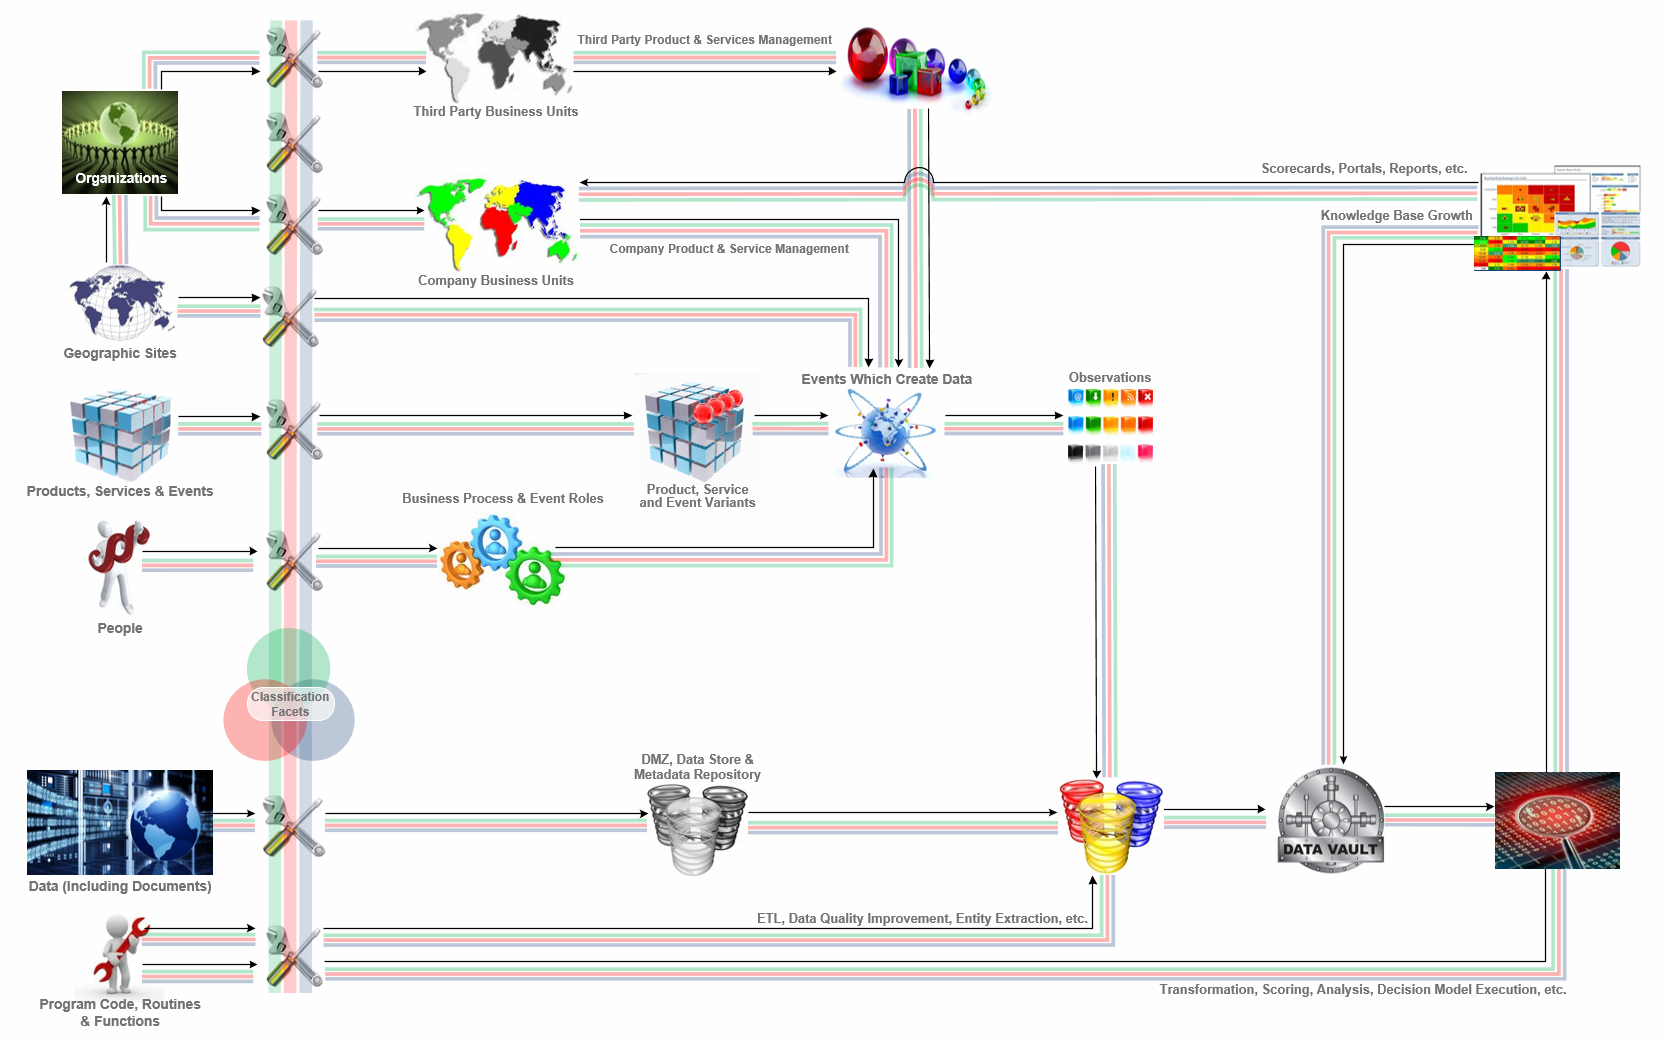
What is Chameleon Metadata
In 1679 German polymath W. Leibniz wrote C. Huygens saying:
"I am not content with algebra, in that it yields neither the shortest proofs nor the most beautiful constructions of geometry. Consequently, in view of this, I consider that we need yet another kind of analysis, geometric or linear, which deals directly with position, as algebra deals with magnitude".
In the original quote Leibniz uses the term "analysis situs" which means position analysis which was transformed to "geometria situs" or "geometry of position". Today, we use similar terms when discussing Graph Theory. But, what does that really mean?
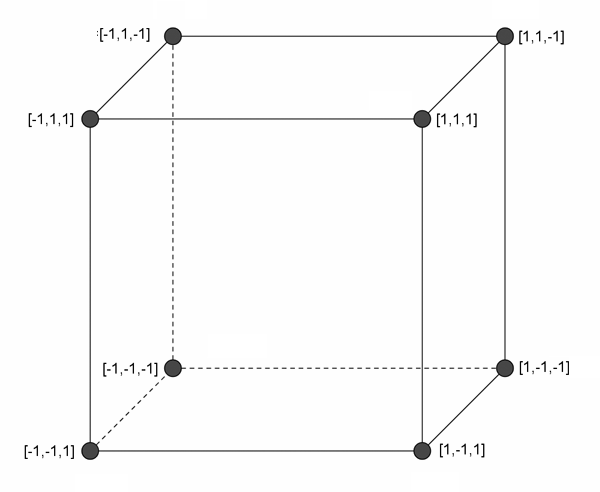
Students are first introduced to using the coordinate system to document position and magnitude in primary school. And, by now we should all know that a line represents a series of points in a two-dimensional space represented by an X-axis and a Y-axis. With three dimensions, it's possible to represent more complex concepts with the addition of the Z-axis.
In data warehouses, as in data science, we represent measurements associated with a specific collection of n dimensions as a "Fact ". In most cases a "Fact" is associated with many more than the three dimensions which suffice when representing simple three-dimensional cubes. Usually, so many dimensions are typically needed that it becomes hard to wrap your mind around what such a shape would look like if it were represented by a graph in an n-axis space (i.e. more than the X,Y and Z axis). Nonetheless, it's common so we can't just ignore them and refer to anything represented by four or more axes as a Hypercube. The collection of plotted points which have been used to describe a specific occurrence of a person, place or thing is known as a Feature Vector or just a Vector. Most statistical packages like "R" or "WEKA" work using features and feature vectors..
Dictionary.com defines a 'Feature' as being "a prominent or conspicuous part or characteristic" or "to be a feature or distinctive mark of". These notions provide the foundation of the approach Chameleon Metadata uses for organizing, indexing, profiling and locating data. Like is typical with statistics software, Chameleon Metadata also treats a collection of features as a vector. A feature vector is always associated with a single, specific occurrence of a person, place or thing. But, that doesn't mean feature vectors must be unique either. Consider the three employees with first names Alice, Bart, and Alice. While the three will always by represented by three feature vectors with one representing each employee, notice how they would be represented by the three different feature vector schemes below:
Feature Vector 1: { department-code, function, hours per week }
Alice: { "IT", "Programmer", 40 }
Bart: { "IT", "Programmer", 40 }
Alice: { "IT", "Programmer", 40 }
Feature Vector 2: { department-code, first name, function, hours per week }
Alice: { "IT", "Alice", "Programmer", 40 }
Bart: { "IT", "Bart", "Programmer", 40 }
Alice: { "IT", "Alice", "Programmer", 40 }
Feature Vector 3: { department-code, employee number, function, hours per week }
Alice: { "IT", 1125, "Programmer", 40 }
Bart: { "IT", 2086, "Programmer", 40 }
Alice: { "IT", 1423, "Programmer", 40 }
As you can see, there are a lot of design and data issues which must be taken into account. But, don't be fooled, all three vectors above may be useful in certain situations and would completely depend on the business question(s) being asked. Chameleon Metadata uses an approach known as a "heavy onboarding footprint". By that, we mean that we put a little more effort into understanding data as it comes in the door that do traditional methodologies. However, by doing a little more work when any data arrives, total cost of ownership of the data ends up being much lower. Mainly because traditional approached to Big Data spend time figuring out what is in each dataset every time it's accessed. But, with Chameleon Metadata, we already know and can now match people, organizations and the events or processes they perform with the data each event/process creates each time it occurs . . . from any source. Here's one possible way to manage everything:
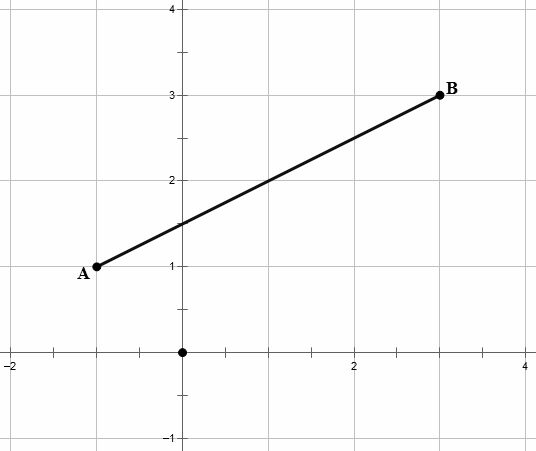

Two Dimensional Space (X,Y)
Three Dimensional Space (X,Y,Z)